
How To Create A Chart With Salesforce
Another question has been asked to our expert Salesforce development team. The question was “how to create a chart with Salesforce.” A chart is a combination of multiple sets of data on a single chart and each set of data based on different fields, so values are easy to compare. We will give you a simple example of how to create a chart with Salesforce using this simple example.
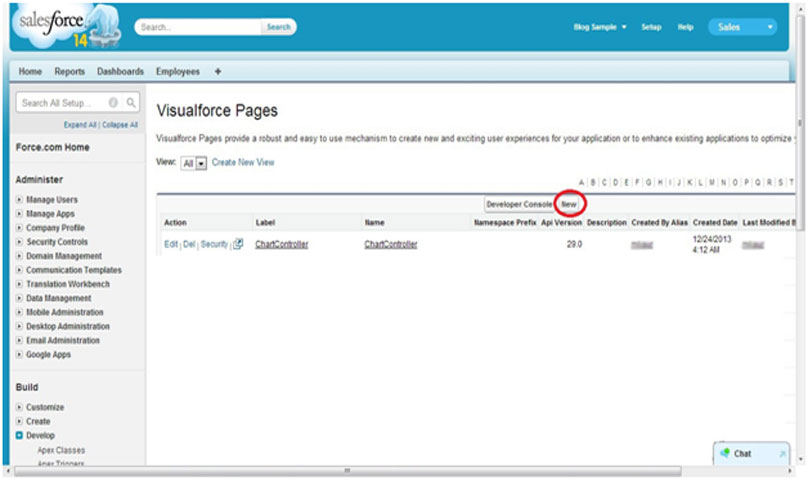
Step1:
Go to Setup in Salesforce → Build → Develop → Pages
Click on the “New Button” to create a new page
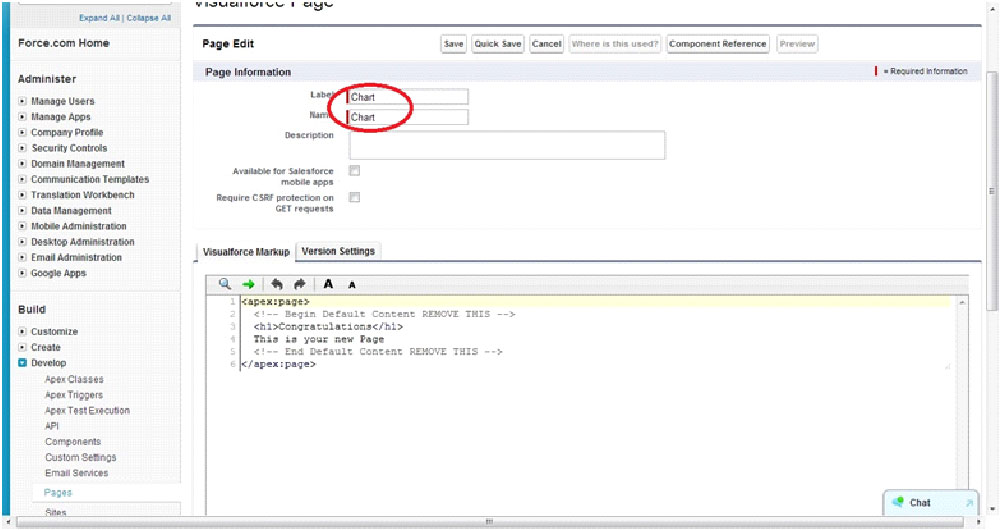
Step2:
Create a Salesforce Visualforce page with the name “Chart”
Step3:
Paste this code in the Salesforce Visualforce editor
| <apex:page controller=”Chart”><apex:chart height=”400″ width=”1000″ data=”{!data}”><apex:legend position=”right”/><apex:axis type=”Numeric” position=”left” fields=”data1″title=”Side- A” grid=”true”/>
<apex:axis type=”Numeric” position=”right” fields=”data3″ title=”Side- B”/> <apex:axis type=”Category” position=”bottom” fields=”name” title=”Side- C”> <apex:chartLabel rotate=”320″/> </apex:axis> <apex:barSeries title=”A” orientation=”vertical” axis=”right” xField=”name” yField=”data3″> <apex:chartTips height=”20″ width=”120″/> </apex:barSeries> <apex:lineSeries title=”B” axis=”left” xField=”name” yField=”data1″ fill=”true” markerType=”cross” markerSize=”4″ markerFill=”red”/> <apex:lineSeries title=”C” axis=”left” xField=”name” yField=”data2″ markerType=”circle” markerSize=”4″ markerFill=”yellow”/> </apex:chart> </apex:page> |
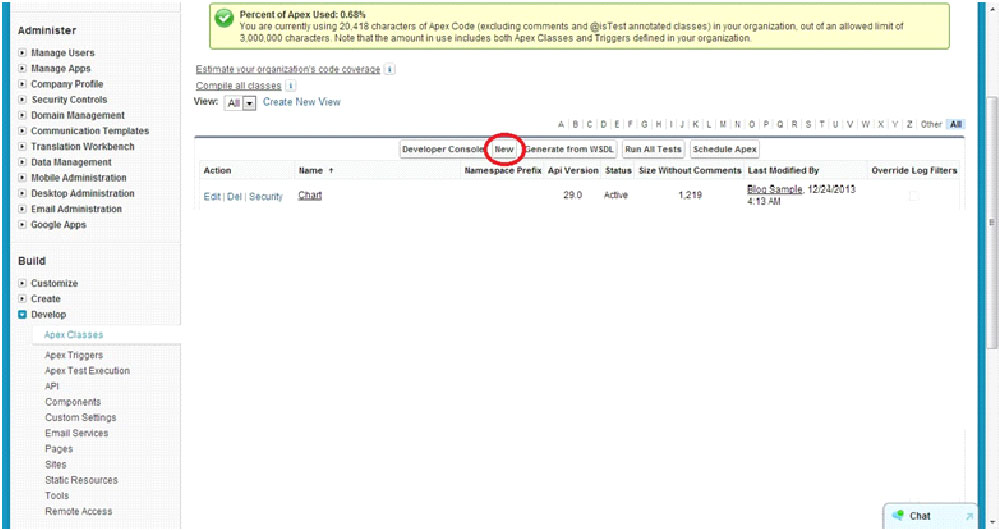
Step4:
Go to Salesforce Setup → Build → Develop → Apex Classes
Click on the “New Button” to create a new class
Step5:
Paste this code in the Class editor
| public class Chart {// Return a list of data points for a chartpublic List<Data>getData() {List<Data> data = new List<Data>();data.add(new Data(‘A’, 31, 40, 44));
data.add(new Data(‘B’, 44, 58, 83)); data.add(new Data(‘C’, 38, 82, 25)); data.add(new Data(‘D’, 74, 48, 85)); data.add(new Data(‘E’, 39, 20, 93)); data.add(new Data(‘F’, 33, 57, 99)); data.add(new Data(‘G’, 92, 03, 60)); data.add(new Data(‘H’, 87, 73, 45)); data.add(new Data(‘I’, 34, 65, 28)); data.add(new Data(‘J’, 78, 66, 56)); data.add(new Data(‘K’, 85, 67, 83)); data.add(new Data(‘L’, 29, 57, 85)); data.add(new Data(‘M’, 74, 57, 85)); data.add(new Data(‘N’, 57, 85, 95)); data.add(new Data(‘O’, 77, 56, 74)); return data; } // Wrapper class public class Data { public String name { get; set; } public Integer data1 { get; set; } public Integer data2 { get; set; } public Integer data3 { get; set; } public Data(String name, Integer data1, Integer data2, Integer data3) { this.name = name; this.data1 = data1; this.data2 = data2; this.data3 = data3; } } } |
Step6:
Open this Salesforce Visualfforce page in your browser you getting like this
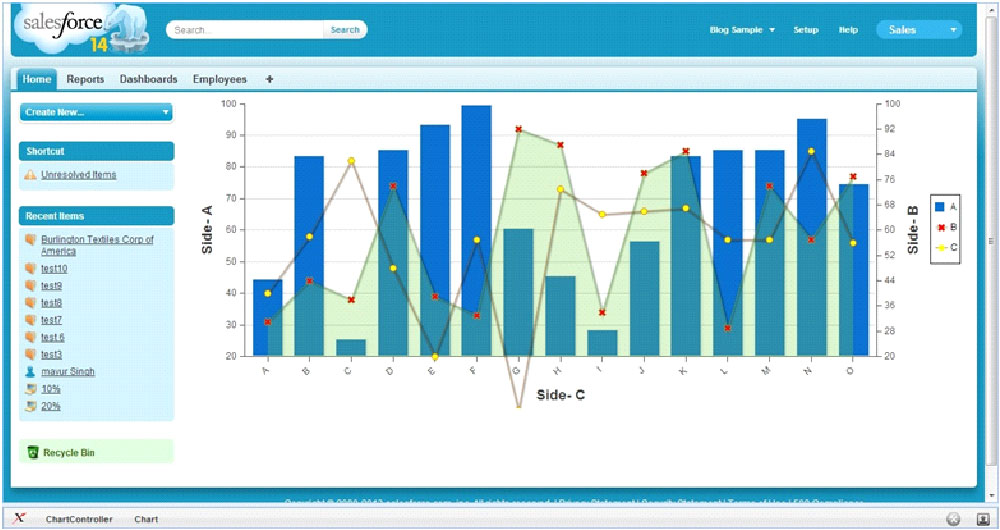
We hope this simple walk through of how to create a chart with Salesforce has been helpful to you. If you need any Salesforce development assistance or anything else then please feel free to reach out to the team at Mind Digital anytime.
Related Posts


Follow us
Recent post
Popular post
- How To Call Batch Apex By Scheduler Class Within Salesforce
- What Is The Importance Of Google Algorithm Updates
- How To Create Dynamic Dependent Picklist Of Objects Within Salesforce
- What Is Wrapper Class & How To Use It In Salesforce
- How To Create Pagination Within Salesforce
- Tips For Hiring A Good Offshore Drupal Development Company
- Web Development Mistakes That Affect Your Online Reputation
- How To Integrate Google Maps Into Your Salesforce Software
- Check Your Link Building Strategy For 2014
- Tips For Selling Products Through Social Networking
- How To Create A Chart With Salesforce
- Benefits of Using India For Outsourcing & Offshore Development
- How To Integrate Salesforce With Facebook
- What Is Service Cloud Console In Salesforce & How To Enable It
- Superior Offshore Web Development At A Reasonable Cost
- How To Create Bucket Fields In Your Salesforce Reports
- 5 Things To Consider When Hiring A Drupal Developer
- Growth Of E-commerce Website Development
- Challenges In Hiring An Offshore Web Development Company
- 10 Tips When Creating Batch Apex In Salesforce
- What To Include & What To Exclude In SEO Plans
- How To Create An Opportunity Using A Visualforce Page In Salesforce
- Hire An Offshore Ruby On Rails Development Company Over A Freelancer
- Hire Drupal Developers Offshore To Increase Your Capabilities
- Effective SEO In A Post Panda Update – The Rules Have Changed
- Common Mistakes In Offshore Web Development
- What To Consider While Hiring A Dedicated Ruby On Rails Developer?
- Smart Phone & Tablet User Penetration
- Tips For Hiring A Good Offshore PHP Development Company
- Why Responsive Web Design Is Essential For Your Business
- How To Email Documents From Salesforce
- Website Development And Website Design Company India
- Why Work With An Offshore Development Company?
- How To Create Tab Panel In Salesforce
- How To Avoid 5 Common Off-Page SEO Mistakes
- The Multi-Billion Dollar Offshore Software Development Industry
- What Are The Advantages Of Digital Marketing Over Traditional Marketing?
- SEO & Conversational Keyword Search
- How To Avoid 5 Common On-Page SEO Mistakes
- How To Add Google Authorship And Its Benefits For Better SEO
- What’s Better For Facebook Ads: CPC Or CPM?
- Questions To Ask Your Potential Search Engine Optimization Partner
- How To Create Batch Apex In Salesforce
- Benefits Of Offshore PHP Development For Your Businesses
- Offshore Magento Development Means More Than Just Development Help
- Why You Should Consider Hiring Joomla Developers Offshore
- What To Look For When Hiring A Dedicated OpenCart Developer
- Stop Using Free Web Templates – Hire A Web Development Company
- How To Manage An Offshore Development Company?
- Hire Offshore Software Professionals To Help Your Business
- Offshore Development Is A Sensible Solution For Recessionary Times
- Why You Should Offshore Your Joomla Website Development
- 5 Tips To Help You Hire A Good Offshore PHP Development Company
- Reasons Why Salesforce CRM Customization Is Easy
- PHP Development – Turn Your Website Into A Multi-Featured Web Application
- 5 Things To Ask A Web Development Company Before Starting Work
- How A Multifaceted Web Development Company Can Help You?
- Take Advantage By Hiring A PHP Development Company From India
- Use Social Media Marketing To Improve Your Brand Identity
- Hiring Dedicated Developers From Offshore Development Companies
- See Measurable Results By Hiring Dedicated Ruby On Rails Developer
- Avoid 4 Common WordPress Development Mistakes
- Can “Developed By” Links Hurt Your SEO?
- How To Get All Salesforce Components In Force.com IDE
- The Manifold Advantages Of Working With An Offshore Web Development Company
- Web Development Company In India Defined
- Hire A Dedicated Drupal Developer To Develop A High Performance CMS
- Offshore Development – The Most Beneficial And Cost Effective Way To Outsource Your Business
- What To Look For When Hiring An Offshore Development Company
- Why Dedicated PHP Web Developers Are In Demand
- How To Avoid Some Common Mistakes When Working With An Offshore Web Development Company
- How To Choose An SEO Company
- Factors To Consider When Hiring Offshore Developers In India
- What To Look For When Hiring Dedicated Magento Developers
- Why Google Create Its Own Title Instead Of Using Yours
- 3 Challenges of Working with an Offshore Web Development Company
- Why Ruby On Rails Development Has Become Popular
- Why Hire A Web Development Company That Also Offers SEO
- 10 Tips And Tricks For Salesforce
- Are Back-links Losing Their Importance To Google Search Rankings
- The Significance Of A Salesforce Developer
- 4 Reasons to Hire A Web Development Agency Over A Freelancer
- Hire A PHP Developer- How Outsourcing Can Be A Key To Success
- Importance Of Strategic Digital Marketing For Business Growth
- Factors To Keep In Mind Before Hiring Dedicated Magento Developer
- Web Development India – For Prompt And Accurate Services
- Looking For An Offshore PHP Development Company, Where Do I Begin?
- 5 SEO Myths
- How To Choose A Company When Hiring Dedicated PHP Developers
- Why You Should Optimize For Local Search
- Hiring Offshore WordPress Developers Can Help Your Business
- How To Use Social Networking To Market Your Business
- Why Offshore Web Development To India Makes Business Sense
- 5 Factors To Consider When Hiring A Web Development Company
- Top Five Benefits Of Salesforce
- Benefits Of Hiring A Dedicated PHP Developer From India
- Using SEO & Social Media Together
- How Can An SEO Company Help Your Profile Online
- Strategic Importance Of Mobile SEO
- Choose The Social Media Network That Suits Your Business
Archives
- May 2026
- April 2026
- March 2026
- February 2026
- January 2026
- December 2025
- November 2025
- October 2025
- September 2025
- August 2025
- July 2025
- June 2025
- May 2025
- April 2025
- March 2025
- February 2025
- January 2025
- December 2024
- November 2024
- October 2024
- September 2024
- July 2024
- June 2024
- May 2024
- April 2024
- March 2024
- February 2024
- September 2023
- August 2023
- July 2023
- June 2022
- May 2022
- March 2022
- January 2022
- August 2021
- July 2021
- June 2021
- May 2021
- January 2021
- December 2020
- September 2020
- August 2020
- July 2020
- June 2020
- April 2020
- March 2020
- December 2019
- November 2019
- October 2019
- September 2019
- August 2019
- July 2019
- June 2019
- May 2019
- April 2019
- March 2019
- February 2019
- January 2019
- December 2018
- November 2018
- September 2018
- April 2018
- February 2018
- January 2018
- September 2017
- August 2017
- July 2017
- June 2017
- May 2017
- April 2017
- March 2017
- February 2017
- January 2017
- December 2016
- November 2016
- October 2016
- September 2016
- August 2016
- July 2016
- June 2016
- May 2016
- April 2016
- March 2016
- February 2016
- January 2016
- December 2015
- November 2015
- October 2015
- September 2015
- August 2015
- July 2015
- June 2015
- May 2015
- April 2015
- March 2015
- February 2015